Hamlet Memoirs
Provided to YouTube by DistroKid
Hamlet Memoirs · Dabu · Simon Swerwer
Dwarf Fortress: Adventure Mode (Original Game Soundtrack)
℗ Crowskull Records
Released on: 2024-04-17
Auto-generated by YouTube.
via YouTube <a href="https://www.youtube.com/watch?v=RRzB-6x4Or4" rel="nofollow">https://www.youtube.com/watch?v=RRzB-6x4Or4</a>

River Forest, Ill

All My Love (Remaster)
Provided to YouTube by Atlantic Records
All My Love (Remaster) · Led Zeppelin
In Through the out Door
℗ 1979 Atlantic Recording Corporation
Guitar: Jimmy Page
Producer: Jimmy Page
Drums: John Bonham
Remastering Engineer: John Davis
Bass Guitar: John Paul Jones
Keyboards: John Paul Jones
Engineer: Leif Mases
Vocals: Robert Plant
Writer: John Paul Jones
Writer: Robert Plant
Auto-generated by YouTube.
via YouTube <a href="https://www.youtube.com/watch?v=86e5BbMYb88" rel="nofollow">https://www.youtube.com/watch?v=86e5BbMYb88</a>
River Forest, Ill
Wish
Provided to YouTube by Universal Music Group
Wish · Nine Inch Nails
Broken
℗ 1992 TVT/ Interscope Records
Released on: 1992-01-01
Composer Lyricist, Producer: Trent Reznor
Producer: Flood
Auto-generated by YouTube.
via YouTube <a href="https://www.youtube.com/watch?v=IU5R8EKsomA" rel="nofollow">https://www.youtube.com/watch?v=IU5R8EKsomA</a>
River Forest, Ill
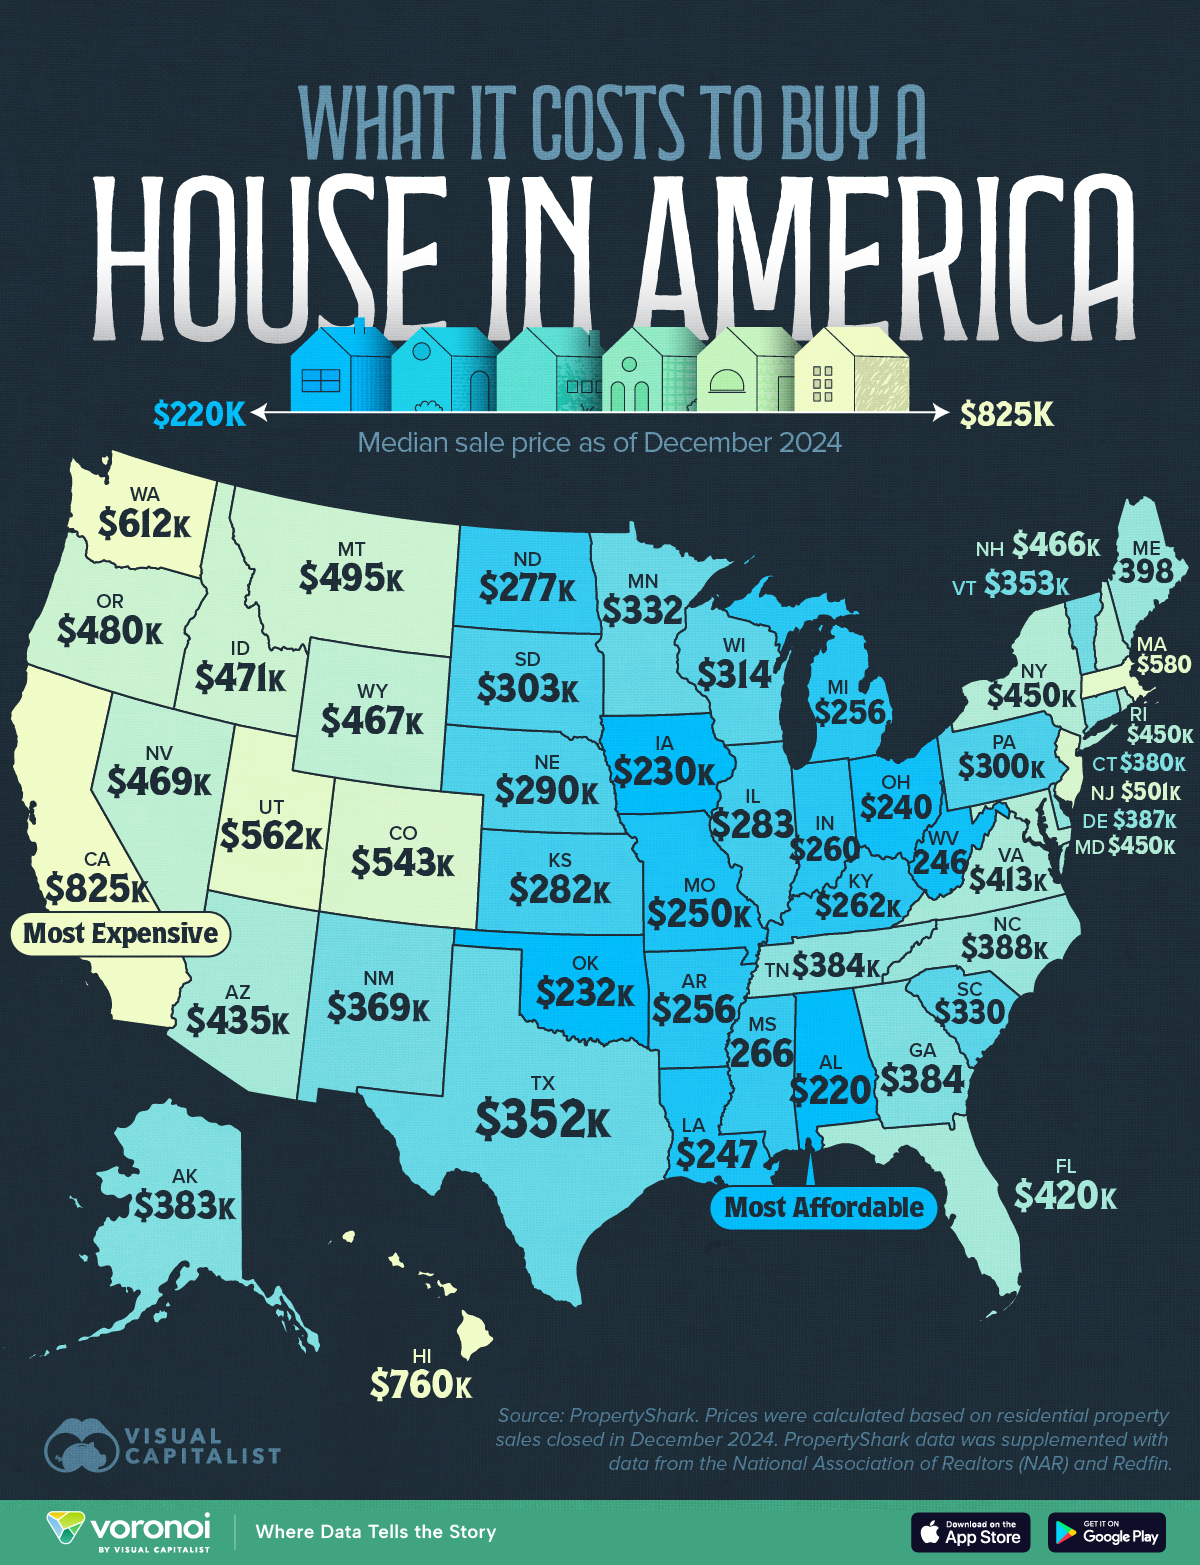
Mapped: Average House Prices by State
This was originally posted on our Voronoi app. Download the app for free on iOS or Android and discover incredible data-driven charts from a variety of trusted sources.
Key Takeaways
-
- California has the highest median home price at $825,000, far surpassing all other states and reflecting ongoing housing supply and demand imbalances
- Midwestern and Southern states remain the most affordable, with Alabama, Ohio, and West Virginia all below $250,000
- Mountain West states like Utah, Montana, and Idaho show elevated prices, highlighting pandemic-era migration trends and rising demand in smaller metros
Across the U.S., home prices vary dramatically by state, shaped by everything from local wages to housing supply. This map visualizes median house prices across all 50 states as of December 2024.
The data for this visualization comes from PropertyShark. It aggregates residential property sales closed in December 2024 and is supplemented with data from the National Association of Realtors and Redfin for full state coverage.
California Leads in Price
Unsurprisingly, California has the highest median sale price at $825,000, driven by demand in coastal cities and limited new housing supply. Cities like San Jose and San Francisco routinely top the list of least affordable U.S. housing markets. California’s tight zoning laws and chronic undersupply exacerbate this divide.
| State | Median Sale Price |
|---|---|
| Alabama | $220K |
| Alaska | $383K |
| Arizona | $435K |
| Arkansas | $256K |
| California | $825K |
| Colorado | $543K |
| Connecticut | $380K |
| Delaware | $387K |
| Florida | $420K |
| Georgia | $384K |
| Hawaii | $760K |
| Idaho | $471K |
| Illinois | $283K |
| Indiana | $260K |
| Iowa | $230K |
| Kansas | $282K |
| Kentucky | $262K |
| Louisiana | $247K |
| Maine | $398K |
| Maryland | $450K |
| Massachusetts | $580K |
| Michigan | $256K |
| Minnesota | $332K |
| Mississippi | $266K |
| Missouri | $250K |
| Montana | $495K |
| Nebraska | $290K |
| Nevada | $469K |
| New Hampshire | $466K |
| New Jersey | $501K |
| New Mexico | $369K |
| New York | $450K |
| North Carolina | $388K |
| North Dakota | $277K |
| Ohio | $240K |
| Oklahoma | $232K |
| Oregon | $480K |
| Pennsylvania | $300K |
| Rhode Island | $450K |
| South Carolina | $330K |
| South Dakota | $303K |
| Tennessee | $385K |
| Texas | $352K |
| Utah | $562K |
| Vermont | $353K |
| Virginia | $413K |
| Washington | $612K |
| West Virginia | $246K |
| Wisconsin | $314K |
| Wyoming | $467K |
The Midwest and South Remain the Most Affordable
States like Ohio ($240,000), Indiana ($260,000), and Mississippi ($266,000) continue to offer the lowest home prices. Many rural or economically stagnant areas see less demand, keeping values lower.
According to the Brookings Institution, population growth in these states has also lagged behind coastal metros, reducing upward pressure on housing costs.
Mountain West States See Price Surges
Montana ($495,000), Idaho ($471,000), and Utah ($562,000) all rank high, reflecting a pandemic-era migration shift. These states attracted remote workers and retirees seeking more space, which pushed up home prices.
Learn More on the Voronoi App 
If you enjoyed today’s post, check out Mapped: Child Care Costs by State in 2025 on Voronoi, the new app from Visual Capitalist.
River Forest, Ill
Nine Inch Nails . Trent’s apology to the crowd at the O2
Some one broke Trent’s mic on stage . Peel it back tour 2025
via YouTube <a href="https://www.youtube.com/watch?v=eeCwUhRX0qs" rel="nofollow">https://www.youtube.com/watch?v=eeCwUhRX0qs</a>
River Forest, Ill
Relax, Guy
At the White House, the President meets with the Prime Minister of Canada to negotiate a new trade deal. After the deal is done, the President spends time with someone close to him.
via YouTube <a href="https://www.youtube.com/watch?v=Q1xR3Xidq84" rel="nofollow">https://www.youtube.com/watch?v=Q1xR3Xidq84</a>
River Forest, Ill
Next Page of Stories